"""
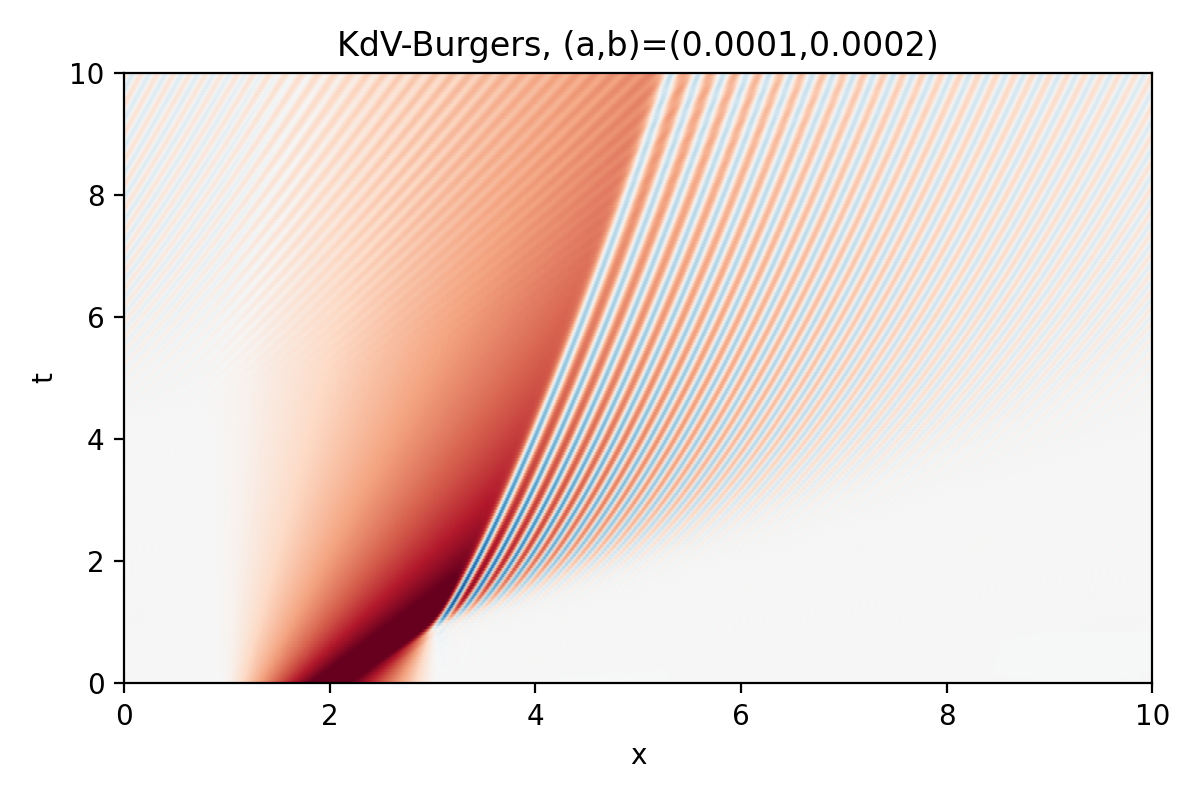
Dedalus script simulating the 1D Korteweg-de Vries / Burgers equation.
This script demonstrates solving a 1D initial value problem and produces
a space-time plot of the solution. It should take just a few seconds to
run (serial only).

We use a Fourier basis to solve the IVP:
    dt(u) + u*dx(u) = a*dx(dx(u)) + b*dx(dx(dx(u)))

To run and plot:
    $ python3 kdv_burgers.py
"""

import numpy as np
import matplotlib.pyplot as plt
import dedalus.public as d3
import logging
logger = logging.getLogger(__name__)


# Parameters
Lx = 10
Nx = 1024
a = 1e-4
b = 2e-4
dealias = 3/2
stop_sim_time = 10
timestepper = d3.SBDF2
timestep = 2e-3
dtype = np.float64

# Bases
xcoord = d3.Coordinate('x')
dist = d3.Distributor(xcoord, dtype=dtype)
xbasis = d3.RealFourier(xcoord, size=Nx, bounds=(0, Lx), dealias=dealias)

# Fields
u = dist.Field(name='u', bases=xbasis)

# Substitutions
dx = lambda A: d3.Differentiate(A, xcoord)

# Problem
problem = d3.IVP([u], namespace=locals())
problem.add_equation("dt(u) - a*dx(dx(u)) - b*dx(dx(dx(u))) = - u*dx(u)")

# Initial conditions
x = dist.local_grid(xbasis)
n = 20
u['g'] = np.log(1 + np.cosh(n)**2/np.cosh(n*(x-0.2*Lx))**2) / (2*n)

# Solver
solver = problem.build_solver(timestepper)
solver.stop_sim_time = stop_sim_time

# Main loop
u.change_scales(1)
u_list = [np.copy(u['g'])]
t_list = [solver.sim_time]
while solver.proceed:
    solver.step(timestep)
    if solver.iteration % 100 == 0:
        logger.info('Iteration=%i, Time=%e, dt=%e' %(solver.iteration, solver.sim_time, timestep))
    if solver.iteration % 25 == 0:
        u.change_scales(1)
        u_list.append(np.copy(u['g']))
        t_list.append(solver.sim_time)

# Plot
plt.figure(figsize=(6, 4))
plt.pcolormesh(x.ravel(), np.array(t_list), np.array(u_list), cmap='RdBu_r', shading='gouraud', rasterized=True, clim=(-0.8, 0.8))
plt.xlim(0, Lx)
plt.ylim(0, stop_sim_time)
plt.xlabel('x')
plt.ylabel('t')
plt.title(f'KdV-Burgers, (a,b)=({a},{b})')
plt.tight_layout()
plt.savefig('kdv_burgers.pdf')
plt.savefig('kdv_burgers.png', dpi=200)
